Difference between revisions of "Activities"

m (→Coronavirus) |
m (→Coronavirus) |
||
| Line 21: | Line 21: | ||
n(t) = n_0 \,\chi^t\,, | n(t) = n_0 \,\chi^t\,, | ||
\end{equation*} | \end{equation*} | ||
where $t$ is the time in units of days and $n_0$ is the number of cases at ''day 1'', which is defined as the day where the first deaths were reported (we started with six deaths), and $\chi$ is the rate at which the cases increase from day to day, namely | where $t$ is the time in units of days and $n_0$ is the number of cases at ''day 1'', which is defined as the day where the first deaths were reported (we started with six deaths), and $\chi$ is the rate at which the cases increase from day to day, namely $n(t+1) = \chi n(t)$. | ||
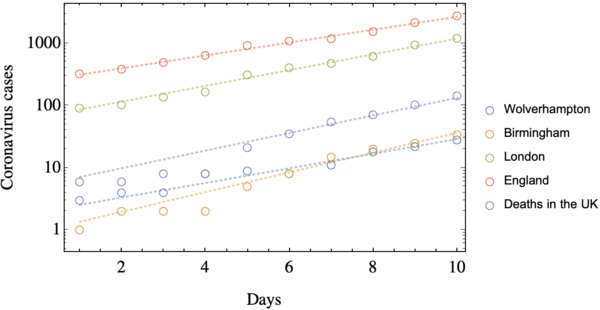
At the early stages of the outbreak, while the government was still trying to tackle the pandemia with the so-called [https://en.wikipedia.org/wiki/Herd_immunity ''herd immunity''], which in practical terms it means that no action was taken, and the contagions was left free to propagate. This measure was in the opposite direction that Europe was taking, where the mobility restrictions were starting to appear. At this early stage, the evolution of the cases was as shown in the figure below, which is shown in logarithmic scale: | At the early stages of the outbreak, while the government was still trying to tackle the pandemia with the so-called [https://en.wikipedia.org/wiki/Herd_immunity ''herd immunity''], which in practical terms it means that no action was taken, and the contagions was left free to propagate. This measure was in the opposite direction that Europe was taking, where the mobility restrictions were starting to appear. At this early stage, the evolution of the cases was as shown in the figure below, which is shown in logarithmic scale: | ||
| Line 30: | Line 30: | ||
| | | | ||
|$n_0$ | |$n_0$ | ||
|$chi$ | |$\chi$ | ||
|- | |- | ||
|'''Wolverhampton''' | |'''Wolverhampton''' | ||
Revision as of 03:15, 4 April 2020
Research Fields
I study the interaction of light with matter.
More specifically, my interest is in the development and application of strongly correlated light, which are the building blocks of technological applications such as quantum spectroscopy, novel sources of quantum light (lying beyond the classical description).
Emitter of quantum light
Polaritons
Using the data that the UK goverment is making available, updating it on a daily basis, one can fit the number of cases (of both infected people in different regions and of deaths across the island) $n(t)$ as a simple equation \begin{equation*} n(t) = n_0 \,\chi^t\,, \end{equation*} where $t$ is the time in units of days and $n_0$ is the number of cases at day 1, which is defined as the day where the first deaths were reported (we started with six deaths), and $\chi$ is the rate at which the cases increase from day to day, namely $n(t+1) = \chi n(t)$.
At the early stages of the outbreak, while the government was still trying to tackle the pandemia with the so-called herd immunity, which in practical terms it means that no action was taken, and the contagions was left free to propagate. This measure was in the opposite direction that Europe was taking, where the mobility restrictions were starting to appear. At this early stage, the evolution of the cases was as shown in the figure below, which is shown in logarithmic scale:
<wz tip="Early stage of the pandemia in the UK">

</wz>
The open circles represent the data and the dashed lines correspond to the Eq. (1) with the following parameters:
| $n_0$ | $\chi$ | |
| Wolverhampton | 2.55 | 1.31 |
| Birmingham | 1.36 | 1.44 |
| London | 86.96 | 1.34 |
| England | 315.25 | 1.27 |
| Deaths in the UK | 7.14 | 1.39 |
which means that