Difference between revisions of "Franck–Hertz experiment"

m |
|||
| Line 24: | Line 24: | ||
h = \frac{eV_0 \lambda}{c}\,. | h = \frac{eV_0 \lambda}{c}\,. | ||
\end{equation} | \end{equation} | ||
== Procedure == | |||
The setup is arranged following the instructions provided by Pasco. | |||
== Results and analysis == | == Results and analysis == | ||
Revision as of 16:32, 22 October 2020
Franck–Hertz experiment
Niels Bohr proposed his atomic model in 1913, whereby the energy levels of the atoms were quantized, so that electrons going around the nucleus (with a positive charge) were only allowed to do so at certain radii. Thus, the energy of the electrons attached to the atom is not a continuous variable but a discrete one. Bohr's atomic model predicted perfectly the emission lines of the Hydrogen atom. In 1914, one year after Bohr's publication [1], Frank and Hertz reported the results of an experiment in which they observe directly the quantization of the energy levels of Mercury atoms. Eleven years later, in 1925, Frank and Hertz received the Physics Nobel prize "for their discovery of the laws governing the impact of an electron upon an atom".
Theory
An electric current is made pass through a tube containing an atomic vapor (In the original experiment, the tube contained Mercury vapor, but at the University of Wolverhampton we have a tube with Argon). In their path along the tube, the electrons collide with the atoms of the vapor. In general these collisions are elastic, and while the direction in which the electrons move may change, their kinetic energy is conserved. Therefore, as the initial kinetic energy of the electrons is increased (by increasing the accelerating potential), we should see an increase of the current across the tube.
The experiment shows exactly this, except that at some point, for a particular accelerating potential $V_0$, the current drops. Further increasing the kinetic energy of the electrons yields again an increase of the observed current, until the potential reaches $2V_0$ at which point the current drops again. In fact, this behaviour repeats itself every time the accelerating potential is an integer number of $V_0$.
The drop in the current indicates that the electrons are losing their energy in the collisions. In other words, when the accelerating potential is a given by $V=nV_0$, the electrons transfer their energy to the atoms. This observation is in agreement with the Bohr nuclear model! Atoms can only absorb energy when it matches one of their allowed values. Thus, when the electrons enter the tube with kinetic energy $E_0=eV_0$, they transfer their energy to the atom, leaving it on an excited state. The dips at subsequent values of $n$ appear because the electrons excite (on average) $n$ atoms along the tube.
With this information we can equate the kinetic energy of the electrons with the energy difference between the excited and ground state of the Argon atom: \begin{equation} eV_0 = h\nu = \frac{h c}{\lambda}\,, \end{equation} where $h$ is Planck constant, $c$ is the speed of light and $\nu$ and $\lambda$ are the frequency and wavelength of the light emitted by the Argon atom. The latter can be obtained through optical methods, and we know that for the sample in our lab $\lambda = 108.1\,$nm. Therfore, we can use our measurements to obtain Planck constant $h$: \begin{equation} h = \frac{eV_0 \lambda}{c}\,. \end{equation}
Procedure
The setup is arranged following the instructions provided by Pasco.
Results and analysis
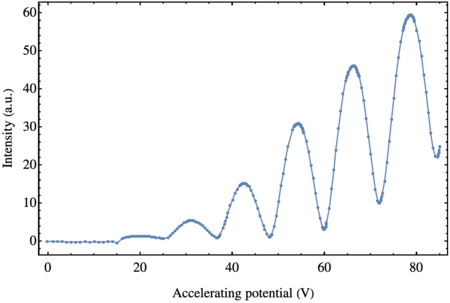
The results of the measurement are shown in the figure below.
As predicted, we observe a series of peaks and troughs. The potentials at which we find the peaks and troughs are the following
| Peaks | Troughs |
|---|---|
| 19.5 V | 25.0 V |
| 31.1 V | 36.8 V |
| 42.8 V | 48.0 V |
| 54.3 V | 59.8 V |
| 66.2 V | 71.9 V |
| 78.6 V | 84.5 V |
More reliable than the position of the peaks and troughs, however, is the difference of the voltage between consecutive peaks (or consecutive troughs). Calculating them, we obtain the value of $V_0$ at which the electrons excite the Argon atoms: \begin{equation} \label{eq:potential} V_0 = (11.86 \pm 0.42)\, \mathrm{V}\,, \end{equation}

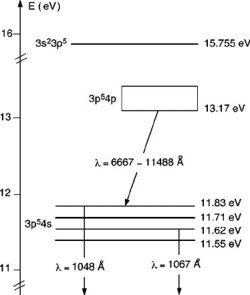
where the uncertainty in the measurement (in this case, $0.42$) is obtained as the standard deviation of the voltage difference. This means that the observed excitation energy of Argon is $E_0 = (11.86 \pm 0.42)\, \mathrm{eV}$, which is consistent with the literature (cf. Fig. 1).
Using the voltage in Eq. (\ref{eq:potential}) we can obtain our value for Planck constant \begin{equation} h = (6.847 \pm 0.241) \times 10^{-34}\,\mathrm{J s}\,, \end{equation} which is 3.3% off its accepted value.
References
- N. Bohr. On the Constitution of Atoms and Molecules, Part I. Philosophical Magazine 26, 1–24 (1913).
- Ts. Petrova, E. Benova, G. Petrov, and I. Zhelyazkov. Self-consistent axial modeling of surface-wave-produced discharges at low and intermediate pressures. Phys. Rev. E 60, 875 (1999).
